Distance Estimation: krepp dist
krepp distcomputes the Hamming distance between individual sequences (e.g., short reads in our case) in a given FASTA/Q file and sufficiently similar (i.e., <25% similarity) reference genomes in the index.- These approximate distances are akin to alignment identity: If you were to align this read (e.g., using Bowtie2), the proportion of mismatches is expected to match krepp's distance estimates.
- Individual estimates for reads may have some error, especially at high distances (>15%), but they are accurate on average, and can recover genome-wide similarities.
- These distances are the main information krepp relies on for various tasks such as phylogenetic placement, taxonomic classification, and for providing sample-wise (i.e., for the entire file) summaries.
Per-read distances (default)
By default, krepp reports distances between individual sequences and all relevant references:
krepp dist -i data/toy-index -q data/query_mixture.fq.gz --num-threads 4 > results/distances_default.tsvThe output is in a tab-separated format, consisting of three columns:
SEQ_ID: sequence/read identifier in the inputREFERENCE_NAME: name of the matching reference in the indexDIST: estimated maximum likelihood distance
head results/distances_default.tsvExpected output:
# software: krepp version: v0.8.2 invocation :krepp dist -i data/toy-index -q data/query_mixture.fq.gz --num-threads 4 -o results/distances_default.tsvSEQ_ID REFERENCE_NAME DISTNC_007484.1-37612 Nitrosococcus_oceani 0.00009NC_007484.1-37612 Nitrosococcus_wardiae 0.20504NC_007484.1-37612 Nitrosococcus_watsonii 0.07074NC_013960.1-34342 Nitrosococcus_oceani 0.18942NC_013960.1-34342 Nitrosococcus_wardiae 0.11605NC_008818.1-42619 NA NaNNC_021291.1-872 Spiribacter_roseus 0.20522NC_009663.1-23622 NA NaNSome observations:
- The exact order of the rows may change across reads, but the mappings should be identical.
- Notice that a sequence identifier may appear across multiple consecutive rows; this means that the corresponding read is mapped to multiple references, each with its own distance.
- The number of unique IDs in the first column is equal to the number of reads in the given query file.
- Some rows could have NA, indicating that there is no reference that could be matched for this particular read.
Other options for distance estimation
Filtering reference hits
By default, krepp reports all reference hits, regardless of their distances.
If you are only interested in references that are sufficiently close compared to the best match, use --filter flag:
krepp dist -i data/toy-index -q data/query_mixture.fq.gz --num-threads 4 \ --filter -o results/distances_filtered.tsvFor each read, this only retains mappings that are not too far away from the reference hit with the minimum distance.
An example showing the impact:
- The total number of mappings goes down from 80,983 to 59,074 (comparing
grep -v NaN results/distances_*.tsv | wc -l). NC_022664.1-89288has 11 hits without--filter, the closest one at 0.06523.NC_022664.1-89288 Nitrosococcus_oceani 0.09644NC_022664.1-89288 Nitrosococcus_wardiae 0.07829NC_022664.1-89288 Alteromonas_stellipolaris 0.08502NC_022664.1-89288 Spiribacter_salinus 0.07165NC_022664.1-89288 Allochromatium_vinosum 0.06582NC_022664.1-89288 Marinomonas_posidonica 0.11331NC_022664.1-89288 Spiribacter_roseus 0.06523NC_022664.1-89288 Alteromonas_mediterranea 0.09313NC_022664.1-89288 Nitrosococcus_watsonii 0.07694NC_022664.1-89288 Marinomonas_mediterranea 0.12875NC_022664.1-89288 Alteromonas_macleodii 0.09642- Using
--filterreduces it to 9 mappings, keeping the ones that are statistically indistinguishable.NC_022664.1-89288 Nitrosococcus_watsonii 0.07693NC_022664.1-89288 Alteromonas_stellipolaris 0.08504NC_022664.1-89288 Nitrosococcus_wardiae 0.07828NC_022664.1-89288 Alteromonas_macleodii 0.09642NC_022664.1-89288 Spiribacter_roseus 0.06520NC_022664.1-89288 Spiribacter_salinus 0.07164NC_022664.1-89288 Alteromonas_mediterranea 0.09310NC_022664.1-89288 Nitrosococcus_oceani 0.09647NC_022664.1-89288 Allochromatium_vinosum 0.06581
- Another option is to keep only the one with the best match (lowest distance) using
--no-multi(default:--multi). - Alternatively, one can directly cap at a maximum distance threshold (e.g., 5%) using
--dist-max 0.05.
Run krepp dist --help to list all options and see their descriptions.
Interpretation of results
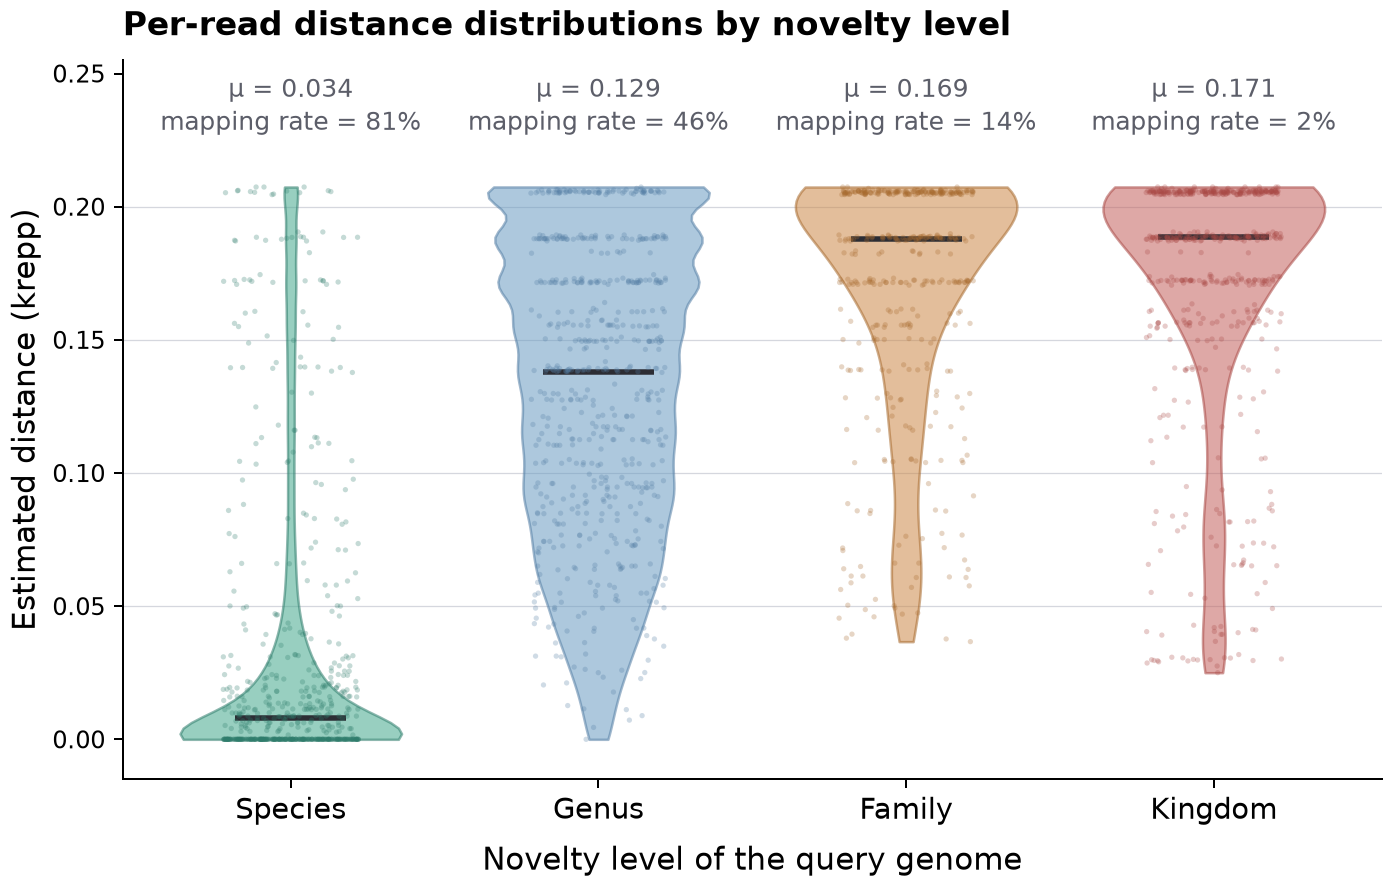
Figure 3. Distribution of per-read krepp distances, grouped by the novelty level of the source query genome. Species-level queries (the index contains another genome of the exact same species) have distances centred near zero (mean 0.034) with a high mapping rate (81%). Queries with genus-level novelty are spread much more widely, with mean and median both well above 0.1, as expected. Family and kingdom-level queries have much lower mapping rates, reflecting the absence of any close relative in the reference set, and are biased towards reads from more conserved regions. Mapped reads with distances saturating near 0.20 also demonstrate the limits of sensitivity (at least in this setting with only a few references and a toy index).
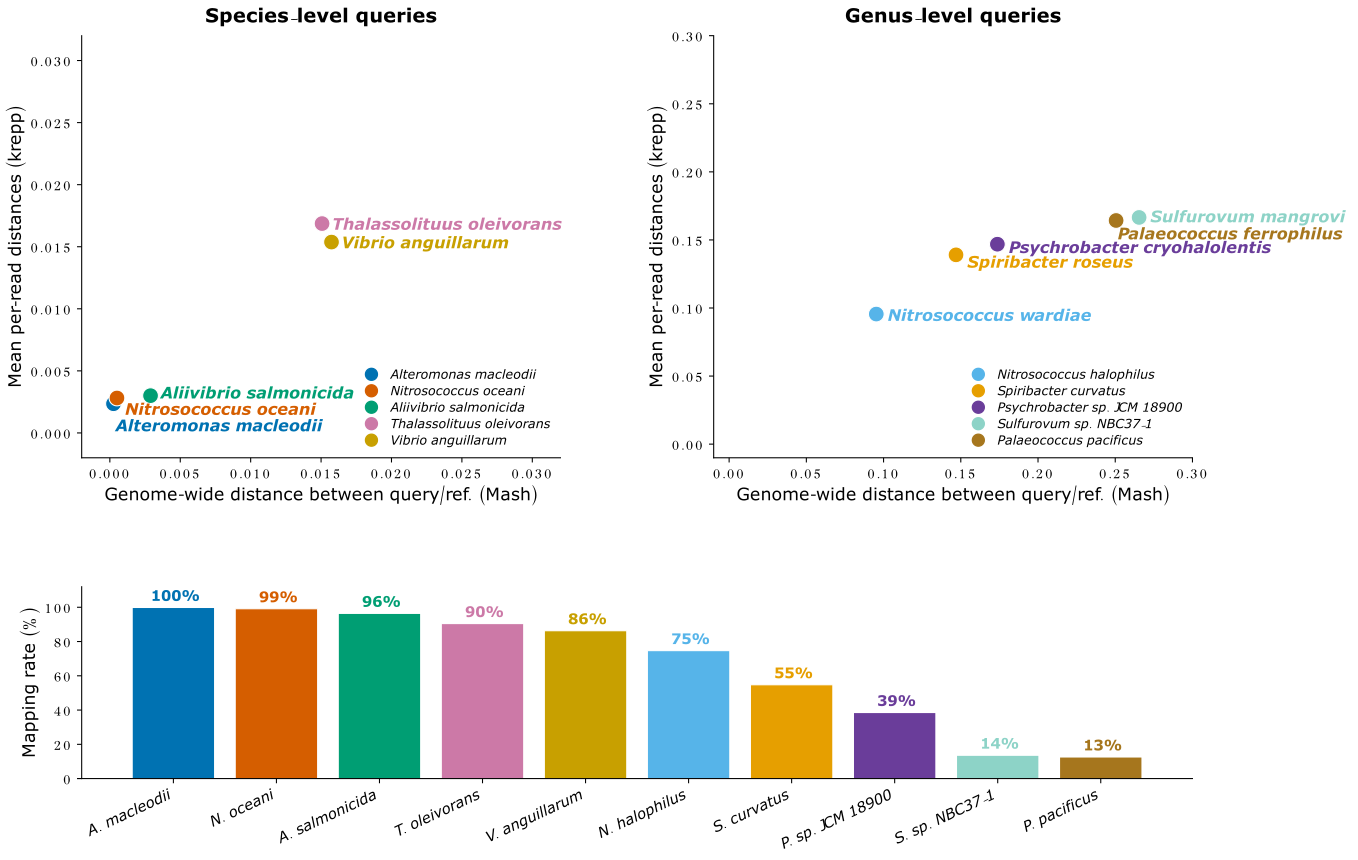
Figure 4. Genome-wide distance (measured by Mash) vs. average per-read distance measured by krepp for each query organism's closest reference genome. Left: top-5 species-level queries by mapping rate. Pairs cluster tightly near the diagonal at distances below 2%, showing close agreement between krepp per-read estimates and whole-genome Mash distances. Right: top-5 genus-level queries, for which krepp means track Mash distances across a wider range (0.10–0.27). Nitrosococcus halophilus hits N. wardiae at exactly 0.0953 on both axes. However, at very high genome-wide distances, krepp starts to underestimate due to the large portion of reads that are not mapped, and also due to mapping bias towards reads that come from more conserved regions. Bottom: mapping rate (fraction of reads with at least 1 hit) for the same 10 organisms, ranging from 99.9% (Alteromonas macleodii) down to 12.6% (Palaeococcus pacificus).
Please note that this is only a toy example where we utilized a very small number of arbitrarily chosen reference genomes. We also downsampled considerably using minimizers and FracMinHash to obtain a small index for the sake of the tutorial. Actual mapping rates and distance accuracy may change in a more realistic setting with more resources and time, most likely in a positive direction!
Counting operational genomic units
- Instead of retaining the per-read distance estimation, one could summarize the entire query file (i.e., a sample) in operational genomic units (OGUs).
- Although the interpretation is different from taxonomic abundance profiles, an OGU table provides a useful high-level view on the entire composition.
- Each read is counted as 1, and its contribution to each genomic unit (i.e., a single reference) is disproportional to the number of equally good matches.
- With
--summarize, krepp internally sets--filter. Then, for each read, it counts the number of reference hits (call itn), each getting an equal share (1/n). The reported result is an OGU table.
krepp dist -i data/toy-index -q data/query_mixture.fq.gz --summarize --num-threads 4 \ > results/distances_summary.tsv && head results/distances_summary.tsvExpected output:
REFERENCE_NAMEis the genomic unit.WEIGHTED_COUNTdenotes the total count of read contributions across the sample.SEQUENCE_ABUNDANCEis the normalized proportion of counts, summing up to 1.# software: krepp version: v0.8.2 invocation :krepp dist -i data/toy-index -q data/query_mixture.fq.gz --summarize --num-threads 4REFERENCE_NAME WEIGHTED_COUNT SEQUENCE_ABUNDANCEAlteromonas_mediterranea 3129.79686 0.06055Nitrosococcus_oceani 6606.76386 0.12782Spiribacter_roseus 6890.63616 0.13331Moorella_thermoacetica 20.82979 0.00040Thermus_thermophilus 17.32136 0.00034Spiribacter_salinus 5273.02897 0.10202Pyrodictium_occultum 21.49657 0.00042Marinomonas_mediterranea 169.35874 0.00328
OGU abundances may not translate into taxonomic abundances
When a read comes from genome A and the index holds two closely related genomes B and C (e.g., three strains of the same species), the counts may be deflated. This may occur for densely sampled species (e.g., E. coli). In a different scenario, some references may end up having inflated counts. However, this can provide a valuable signal in downstream analysis (i.e., machine learning, prediction, or sample comparison via UniFrac).